A defensible spectrum monitoring log pairs time-stamped measurements with replayable IQ captures, so an interference event can be re-examined long after it happened. This guide breaks down the required fields, standards alignment, and record-and-playback workflows that turn RF data into compliance evidence.
What Makes a Spectrum Monitoring Log Admissible as Compliance Evidence?
A spectrum monitoring log only becomes evidence once it can hold up to someone who wasn't there when the capture happened—an auditor, a regulator, or opposing counsel. So the record has to show what was measured, when, where, with which instrument and settings, and in a form that can actually be replayed rather than just described. A screenshot of a live trace is a claim; a time-stamped capture file is a record. That difference is the line I draw between documentation and evidence, and it shapes every field I insist on in a log schema.
Most monitoring setups run on three layers: the sensors or receivers that collect RF measurements, the processing software that stores, classifies, and visualizes the data, and the analysis workflows that interpret the results. Evidence quality depends on all three working together. If the sensor does a poor job of timestamping, no amount of software can restore that accuracy later. If the workflow overwrites raw data with smoothed traces, replay becomes impossible. The guiding principle here is simple: monitoring turns the RF environment into evidence, and interpretation comes after measurement — it should never be baked into the record itself.
Core Fields: Timestamps, Frequency, Power, Bandwidth, and IQ Captures
Any log I've built or reviewed that actually held up under scrutiny had a minimum set of fields in common. The table below is the schema I'd start with, organized around the question each field has to answer when an auditor comes calling.
| Field | What It Records | Audit Question Answered |
|---|---|---|
| Timestamp | UTC start and stop time, with time source noted (GPS, NTP) | When exactly did the event occur? |
| Center frequency and span | Tuned frequency, sweep range, resolution bandwidth | Where in the band was the measurement made? |
| Power and level | Detected power, reference level, DANL of the instrument | How strong was the signal, and could the instrument have seen it? |
| Bandwidth | Occupied or analysis bandwidth of the capture | Was the full emission captured, not just a slice? |
| IQ capture file | Raw samples with metadata header | Can the event be replayed and re-measured? |
| Instrument and settings | Model, serial number, firmware, gain, attenuation, antenna | Was the measurement repeatable and traceable? |
| Location | GPS coordinates or fixed site identifier | Where was the receiver when it recorded this? |
The field that's most often left blank is also the one that carries the most weight: the IQ capture. Take Berkeley Nucleonics' ICX-FieldHawk Data Record and Playback — it writes spectrum and IQ to file with timestamps, either at up to 100 MHz bandwidth into 128 Mbyte of built-in memory or continuously at up to 25 MHz. Spell out that burst-versus-continuous distinction in the log itself. Otherwise, when an auditor hits a gap in the record, they have no way to tell whether nothing was there or the recorder simply couldn't keep up.
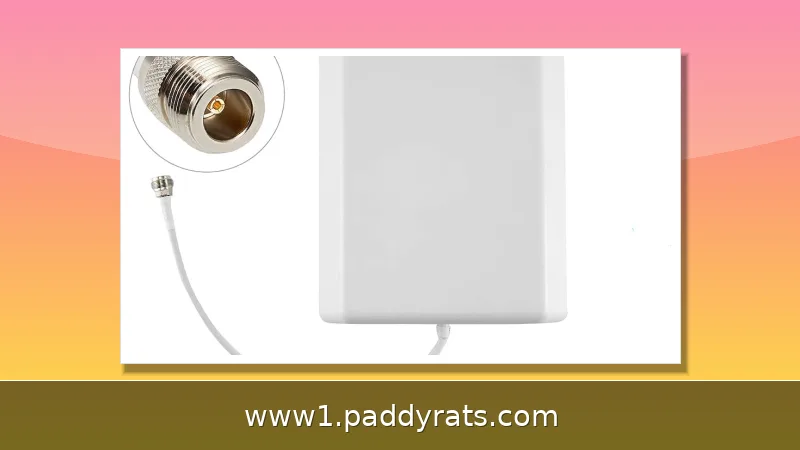
Instrument metadata isn't just bureaucratic padding—it actually changes what the instrument can and can't see. Sweep speed, resolution bandwidth, and spur rejection settings all shape the resulting trace. The ICX-FieldHawk, for instance, sweeps at 1 THz/s at 250 kHz RBW with spur rejection bypassed, and that bypass needs to be logged alongside the measurement, since it affects which artifacts may show up in the trace. The same logic applies to the RFA-3100-N directional antenna, which covers 500 MHz to 10 GHz with 5 dBi typical gain and a 20 dB amplifier with bypass. Whether that amplifier was engaged should be recorded too, because it shifts the effective noise floor—and a weak signal can end up looking strong.
Record and Playback: Preserving Brief and Intermittent Interference Events
Intermittent interference is the hardest thing to prove after the fact. A transient burst lasting only milliseconds will often slip right past a periodic sweep log, and by the time an investigator gets to the site, the emitter has gone quiet. Record and playback gets around this: the investigator can replay the capture, zoom in on the exact moment, and measure the signal at their own pace. The recording then travels with the report, so the enforcement case rests on actual data rather than someone's recollection.
Order of operations is what makes or breaks this: capture the event first, then go find the source. A time-stamped recording proves the interference occurred and gives you something concrete to characterize; a directional bearing tells you roughly where it came from. Do it the other way around — chasing a bearing before you've secured a recording — and you may lose the only evidence that the event ever happened. I've seen enforcement files built entirely on directional notes with no raw capture behind them, and those are hard to defend once the emitter starts disputing how the signal was characterized.
Some interference mechanisms deserve to be called out by name in your documentation: intermodulation distortion products like 2f1 - f2 and f1 + f2 - f3, frequency drift, excessive transmission power, and transient or intermittent emissions. Each one leaves a different signature in the record, so naming the mechanism in the analysis layer—kept separate from the raw capture—is what keeps the evidence chain clean. The capture itself stays neutral; the interpretation sits on top of it as a labeled layer.
Mapping ITU-R Recommendations to Logging Workflows
Two ITU recommendations lay the groundwork for automated monitoring. ITU-R SM.1537 addresses how spectrum monitoring systems get automated and integrated with automated spectrum management, so measured data can flow straight into the system instead of being re-keyed by hand. ITU-R SM.2117 sets out guidelines and technical specifications for spectrum monitoring and interference measurement using digital techniques, I/Q data included. Read together, they describe the same architecture this log format assumes: sensors feeding structured, machine-readable records into a management system.
It helps to be clear about what these documents actually are. The ITU Spectrum Monitoring Handbook is really a grab bag of suggested best practices for regulators, not a rulebook of hard requirements, and even the recommendations inside it are meant to guide rather than command. So if you're an operator putting together a compliance file, the smart move is practical: line up your field names and time conventions with ITU terminology. That way, when a regulator opens your log, the structure looks familiar right away, even if no clause actually forces you to do it.
On the information security side, ISO/IEC 27001:2022 Controls A.8.15 (Logging) and A.8.16 (Monitoring activities) apply to the record-keeping layer around RF data. SOC 2 Type II tests control effectiveness over an observation period typically spanning three to twelve months, and continuous logging supplies evidence across that whole window rather than at a single point in time. PCI DSS similarly provides step-by-step lists of event log documentation, which is useful as a checklist discipline even outside payment environments.
Fixed Stations vs Mobile Response: Logging Architectures Compared
Fixed and mobile deployments produce different evidence profiles, and the log format should reflect which one generated the record. The comparison below summarizes the tradeoffs I weigh when specifying a monitoring setup.
| Dimension | Fixed Station | Mobile Response |
|---|---|---|
| Coverage | Continuous, single location | Targeted, location varies per event |
| Time record | Long unbroken baseline | Event-bounded captures |
| Location metadata | Fixed site ID plus coordinates | GPS coordinates per capture |
| Typical hardware | LAN-connected analyzer on Gigabit Ethernet | USB analyzer or handheld unit |
| Best evidence use | Proving persistence and pattern over time | Proving a specific event occurred |
Form factor affects how the log gets built. HAROGIC's SA Series is a USB form factor under 500 g, the PX Series is a 1.5 kg USB unit, and the Handheld Series comes in at 1.5 kg. The ICX-Series USB analyzer integrates into unattended setups running scheduled sweeps and recordings through the API, while the LAN variant places the module on Gigabit Ethernet for a remote post. Anritsu's MS27102A is a remote spectrum monitor designed to mitigate interference and identify illegal or unlicensed signal activity.
The ICX-045, 060, and 090 models add GPS-referenced heat maps in Mapping mode as standard, which matters for mobile work where each capture needs a location attached without manual entry. The ICX-FieldHawk-R packages the same recording capability in an IP68 impact-protected chassis rated to -40 °C, a specification that determines whether a log can be collected at all in field conditions. HAROGIC analyzers, for comparison, cover 9 kHz to 4.5, 6, 9, 20, or 40 GHz with phase noise as low as -110 dBc/Hz at 1 GHz and 10 kHz offset, DANL of -168 dBm/Hz at 1 GHz, sweep speed over 1 THz/s at 250 kHz RBW, and an open API with C++, Python, Linux, and Windows support — the API being what makes scheduled, unattended logging practical.
How Do You Build a Baseline Before You Can Prove a Deviation?
Evidence of interference is meaningless without a documented picture of normal. I start every deployment with receive-only monitoring, build a baseline, and document what normal looks like before enabling alerts. The baseline record should include noise floor measurements, ambient interference, and occupancy patterns captured over a representative period, with the same field schema used for event captures so the two can be compared directly in an audit.
A pre-show RF site audit is a good concrete example of baseline work. Sweeping UHF 470 to 698 MHz maps active TV channels, noise floors, and ambient interference before an event, and raw scan data can be exported through an SDK or API to coordination tools such as SoundBase or Wireless Workbench. When something goes wrong later, the pre-event baseline is what turns a vague complaint into a measurable deviation.
Two verification workflows build on that foundation. Carrier-mask verification confirms that uplink transmissions remain within allocated bandwidth masks, and spurious and harmonic detection sweeps broad ranges for unwanted emissions. Both produce records that fit the same log format, which is the point: one schema, many measurement types, so a compliance reviewer is not asked to learn a new structure for every test.
Common Pitfalls: Manual Evidence, Stale Records, and Missing Context
Manual evidence collection is the most common failure mode I encounter. The 2026 State of Continuous Compliance Monitoring report found that 83% of organizations reported moderate or major delays from manual compliance work, 53% said roughly one full-time employee's worth of effort goes to evidence collection, 85% delayed or eliminated legacy GRC activities, and 44% postponed control testing and monitoring. The pattern is familiar: evidence goes stale, context goes missing, and unresolved exceptions get presented as completed tasks. That is compliance theatre, not compliance.
The cost of weak evidence shows up outside the compliance function too. IBM's Cost of a Data Breach Report 2025 put the average time to identify a breach at 181 days plus 60 days to contain, with a global average breach cost of USD 4.44 million and a U.S. average of USD 10.22 million. Long detection windows are exactly what continuous, time-stamped logging is designed to compress, and the same record that satisfies an auditor also shortens investigation time.
Finally, be honest about limits in the log itself. Monitoring does not automatically tell you who is transmitting, whether the transmission is authorized, the full message content, or operator intent. Those answers may require direction finding, decoding permissions, or regulatory investigation. Use of spectrum monitoring and counter-monitoring systems is subject to applicable national laws and regulations, with deployment restricted to authorized security, governmental, and institutional users, and SDR-based monitoring does not replace certified compliance testing or national spectrum authority work.
How Should the Evidence Trail Be Automated Around a Control?
Continuous monitoring connects telemetry, control logic, risk decisions, and response into one loop. The automation that matters for compliance is not the act of checking a box but the evidence trail built around a control: scheduled sweeps that run whether or not anyone remembers, captures written to immutable storage with hashes, and a log index that links each record to the control it supports. Automate the trail, and the checkbox takes care of itself.
In practice this means putting the analyzer on a schedule through the API, defining retention rules that match the observation period your auditor tests against, and exporting records in a format that survives a change of tooling. A log format is only as good as its portability. If the evidence cannot leave the vendor's platform, it is a dashboard, not a record.
What Should a Spectrum Monitoring Log Include for Compliance Evidence?
The short answer is: enough detail to replay the event. A defensible log pairs measurements with time stamps and sufficient metadata to reconstruct what happened. The ICX-FieldHawk captures spectrum and IQ to file with timestamps, at up to 100 MHz bandwidth into 128 Mbyte of built-in memory or continuously at up to 25 MHz, so a fleeting interference event can be replayed and measured later. Add instrument settings, antenna details, and location, and the record stands on its own.
The longer answer is that the log must separate measurement from interpretation. Raw captures, derived traces, and analyst conclusions belong in distinct layers with clear labels. When an auditor asks how a conclusion was reached, the answer should be a pointer to a replayable file, not a narrative. That separation is what distinguishes a monitoring practice from a folder of screenshots, and it is the single design decision that most affects whether a log holds up.
How Does Spectrum Monitoring Differ From a One-Time Analyzer Check?
A spectrum analyzer is a tool; spectrum monitoring is a persistent practice. Monitoring implies repeated measurements, automated collection, long-term records, or networked sensing across multiple locations. That is why monitoring is tied to operations, enforcement, compliance, or security awareness rather than bench testing. A single sweep answers what the spectrum looks like right now; a monitoring log answers what it has looked like, what changed, and when.
This distinction drives hardware and software choices. A bench analyzer does not need an open API or scheduled recording, while a monitoring deployment does. It also changes the evidence standard: a one-time check produces a measurement, and a monitoring practice produces a record with a time dimension, which is what auditors and regulators actually evaluate.
Frequently Asked Questions
What should a spectrum monitoring log contain to serve as compliance evidence?
A defensible log should pair measurements with time stamps and enough detail to replay the event. The ICX-FieldHawk captures spectrum and IQ to file with timestamps, at up to 100 MHz bandwidth into 128 Mbyte of built-in memory or continuously at up to 25 MHz, so a fleeting interference event can be replayed and measured later. Instrument settings, antenna details, and location should accompany each capture.
How does spectrum monitoring differ from a one-time spectrum analyzer check?
A spectrum analyzer is a tool, while spectrum monitoring is a persistent practice. Monitoring implies repeated measurements, automated collection, long-term records, or networked sensing across multiple places, which is why it is tied to operations, enforcement, compliance, or security awareness rather than just bench testing. The time dimension is what makes a monitoring record auditable.
Can spectrum monitoring logs prove who transmitted an unauthorized signal?
Not by themselves. Monitoring can show that a signal exists, where in the band it appears, how often and how strong, and whether behavior changes. It does not automatically reveal who is transmitting, whether the transmission is authorized, the message content, or operator intent. Those answers may require direction finding, decoding permissions, or regulatory investigation.
What ITU recommendations govern automated spectrum monitoring and logging?
ITU-R SM.1537 addresses automation and integration of spectrum monitoring systems with automated spectrum management, enabling measured data to be used automatically. ITU-R SM.2117 provides guidelines and technical specifications for spectrum monitoring and interference measurement using digital techniques, including I/Q data use. The ITU Spectrum Monitoring Handbook collects suggested best practices rather than binding requirements.
What fields should a spectrum monitoring log include for compliance evidence?
A defensible log should record UTC timestamps with the time source, center frequency and span, detected power and reference level, occupied bandwidth, an IQ capture file with metadata, instrument model and settings, and location. Together these fields let an auditor reconstruct what was measured, when, where, and with what equipment.
Why is IQ capture important in spectrum monitoring records?
IQ capture preserves raw samples that can be replayed and re-measured later, unlike a screenshot or smoothed trace. This matters most for brief or intermittent interference that a periodic sweep may miss. The log should also state whether capture was burst or continuous, so gaps are not mistaken for genuine signal absence.